
Instagram engagement rate is the percentage of your followers who actively engage with each post (likes, comments, saves, shares) divided by total followers. The formula is simple: (Likes + Comments + Saves + Shares) ÷ Followers × 100. In 2026, anything above 3% is good, 6%+ is excellent, 10%+ is elite. Small accounts (under 10K followers) typically have higher rates than mega accounts because their audiences are more invested.
⚡ Key takeaways
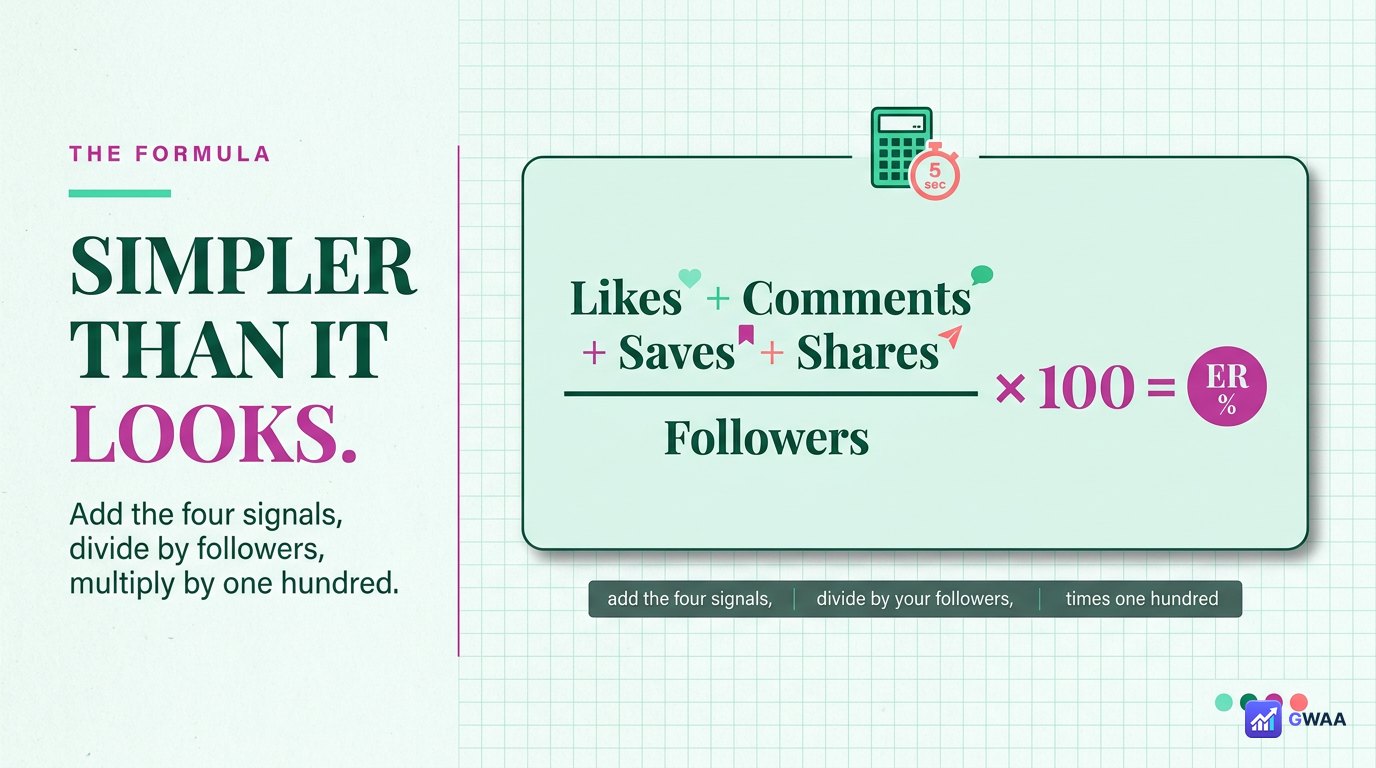
- Formula: (likes + comments + saves + shares) ÷ followers × 100.
- Good = 3%+, excellent = 6%+, elite = 10%+.
- Small accounts beat mega accounts on engagement rate.
- It matters more than follower count for monetisation.
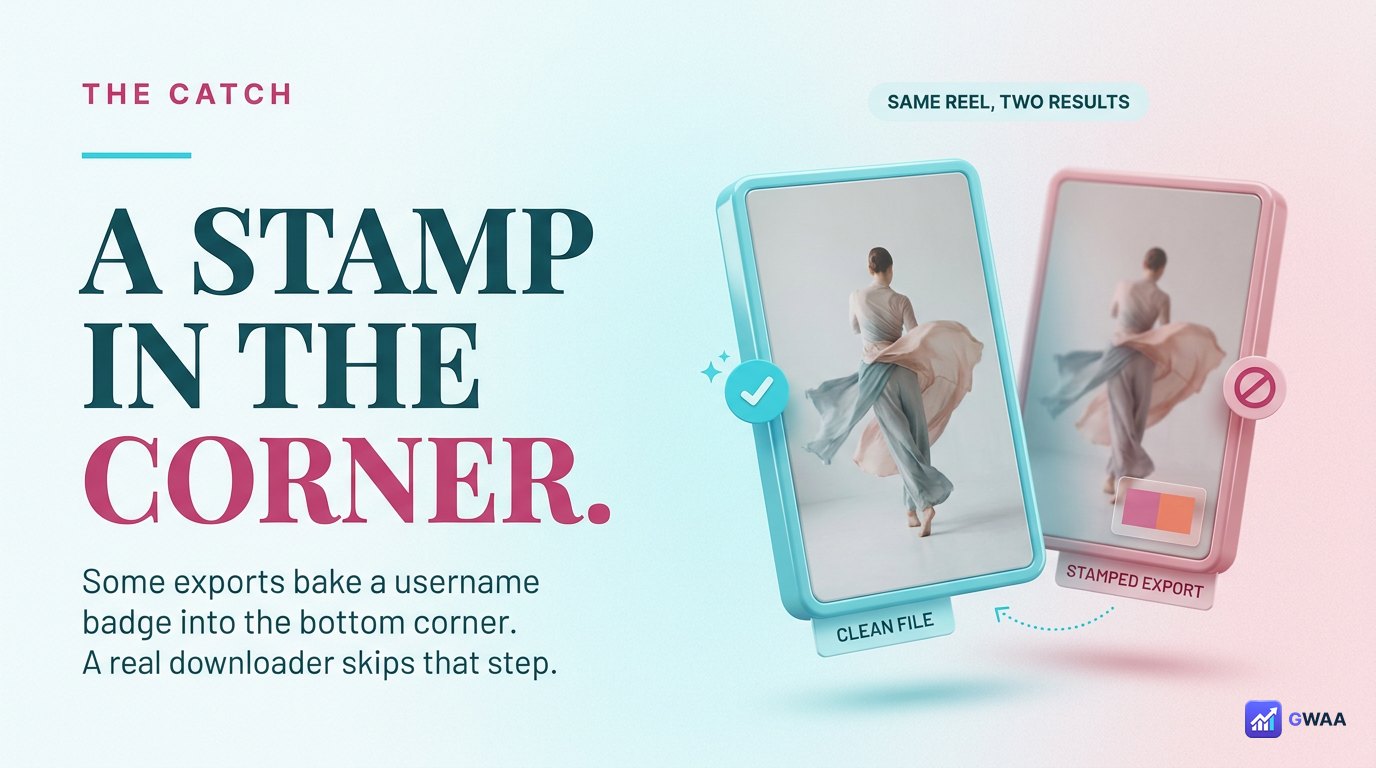
- Buying followers tanks your rate — avoid at all costs.
What engagement rate actually means
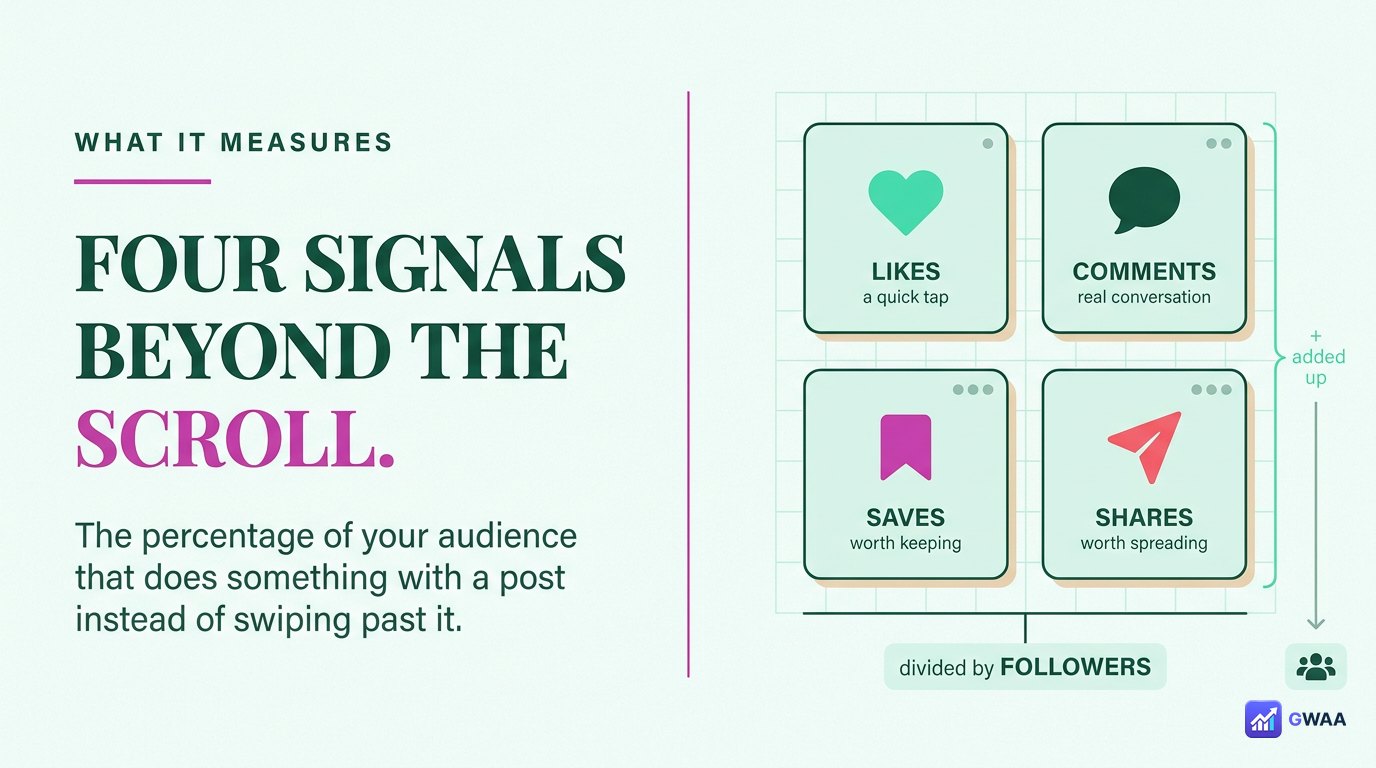
Engagement rate is the metric that tells you what percentage of your audience actually does something with your content beyond scrolling past it. The four signals it measures:
- Likes: Quick positive signal — tapping the heart icon.
- Comments: Deeper engagement — someone typed a response.
- Saves: High-intent — they want to return to it later.
- Shares: Highest-intent — they sent it to someone else.
Each carries different weight in the algorithm. Saves and shares are valued highest because they suggest your content was meaningful enough to revisit or recommend. Likes are easy and frequent; saves require effort.
The formula (it’s simpler than it looks)
The standard formula:
Engagement Rate (%) = (Likes + Comments + Saves + Shares) ÷ Followers × 100
Some marketers prefer dividing by reach (unique accounts the post reached) rather than followers, which gives a different number called “engagement rate by reach”. Both are valid; we use the follower-based version here because it’s the standard for comparing accounts.
If you have a business or creator account, Instagram’s built-in Insights does this calculation for you per post and per period. For personal accounts or third-party analysis, you can calculate manually or use a tool like the GWAA Profile Viewer.
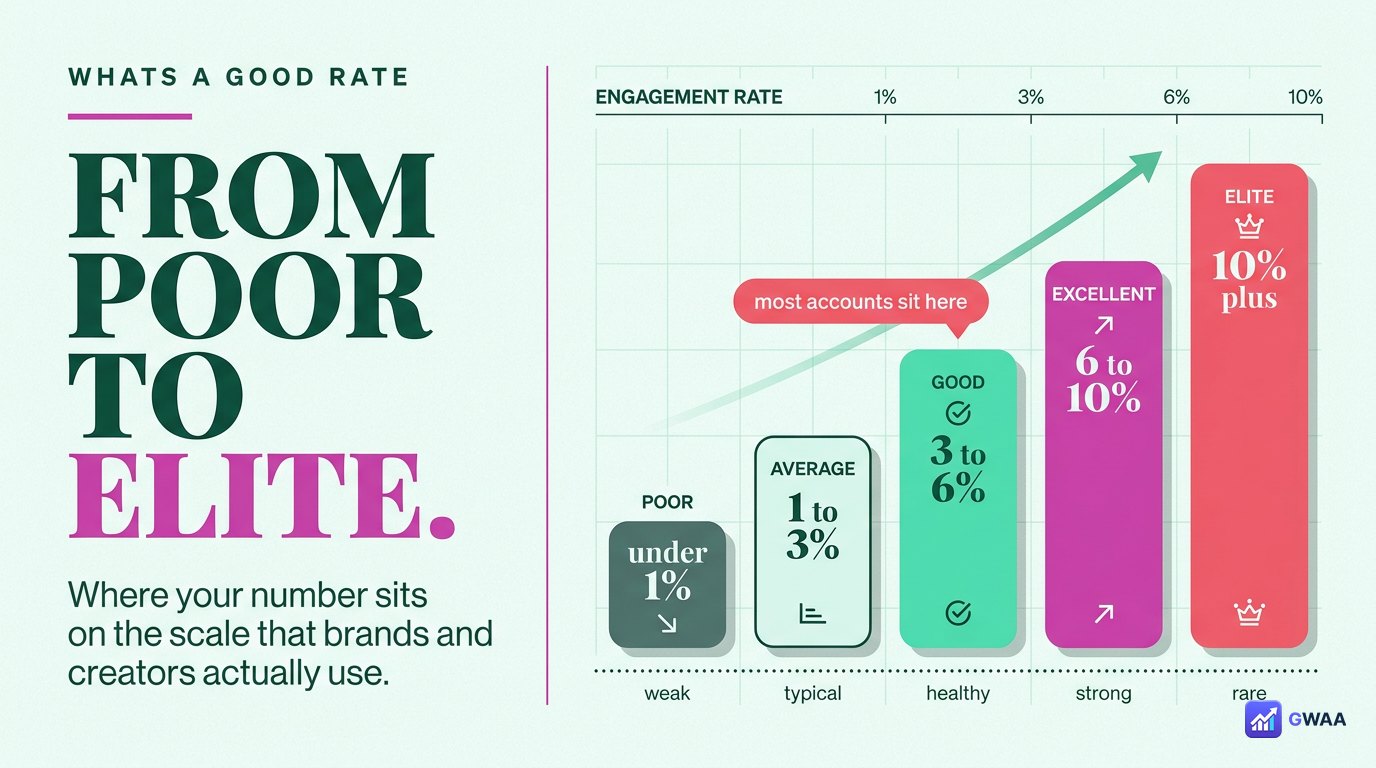
What counts as a “good” engagement rate?
2026 benchmarks across Instagram, taken from large-scale industry surveys:
- Under 1%: Poor — either a bot-heavy follower base or content that doesn’t resonate.
- 1–3%: Average — typical for established accounts. Nothing wrong, but nothing remarkable.
- 3–6%: Good — your audience is genuinely interested. This is the target range for most creators.
- 6–10%: Excellent — well above average. Brand partnerships will notice.
- Above 10%: Elite — rare. Usually small, niche, highly engaged accounts.
These benchmarks shift slightly year-to-year — engagement rates have been gradually declining across all of Instagram for the past five years as the platform got noisier. Today’s 3% would have been 5% in 2020.
Why small accounts beat big ones
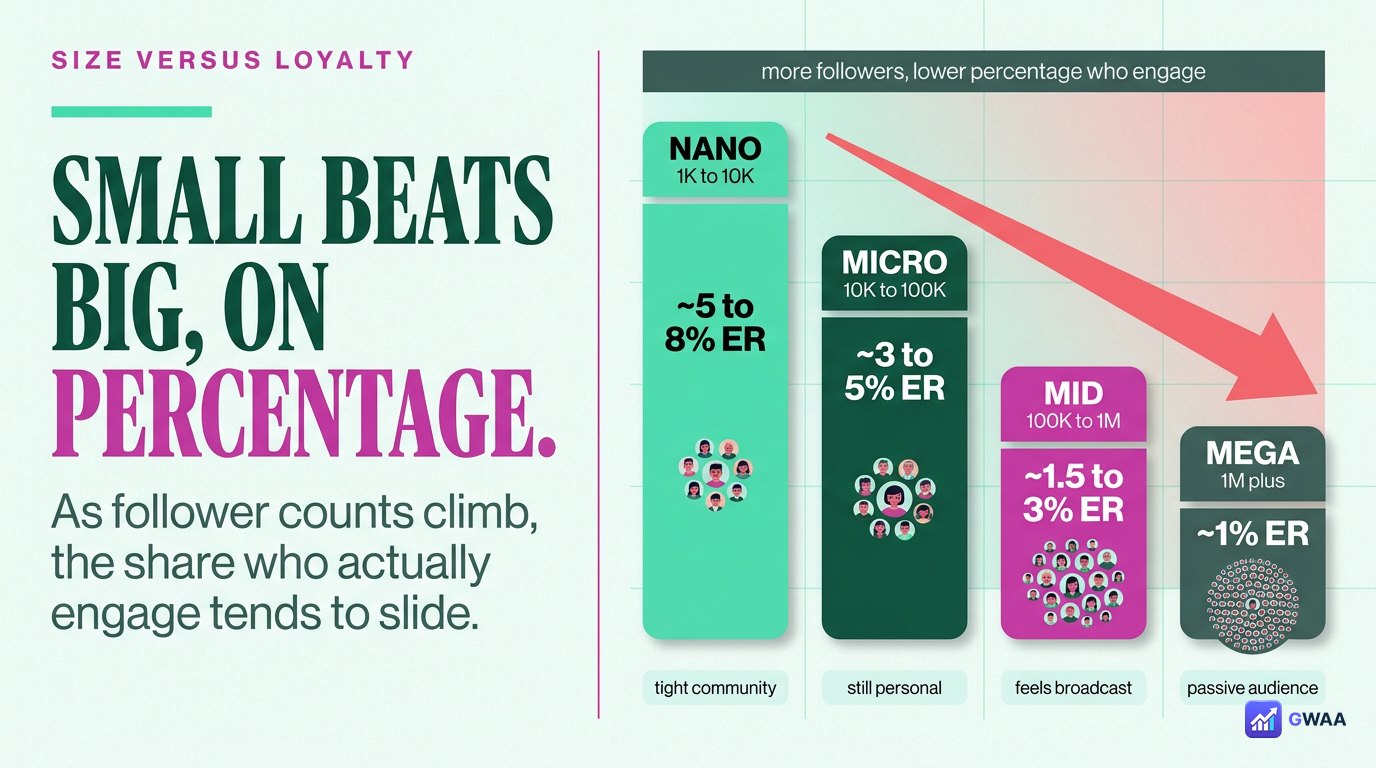
One of the consistent patterns in engagement data: smaller accounts typically have higher engagement rates than larger ones. A typical breakdown:
- Under 10K followers: 4–8% average engagement rate.
- 10K-100K followers: 2–4% average.
- 100K-1M followers: 1–2% average.
- 1M+ followers: Often under 1%.
Three reasons this happens:
- Audience quality drops at scale. Small accounts attract followers who genuinely care. Big accounts accumulate passive followers.
- Niche communities engage harder. A 5K-follower account about model trains has fans; a 5M-follower lifestyle account has audiences.
- Mega accounts attract bots. Big audiences are bot magnets, which inflate follower count without engagement.
Why engagement rate matters more than followers

If you’re trying to monetise an Instagram account, engagement rate is the metric brands actually look at, often more than follower count:
- Brand partnerships increasingly require minimum engagement rates (typically 2-3%) before considering a creator, regardless of follower count.
- Influencer marketing platforms price deals based on engaged-follower count, not total followers.
- The algorithm rewards posts with high engagement by showing them to more people, creating a virtuous cycle.
- Sales conversion correlates with engagement, not follower count — a 10K account at 8% ER often outperforms a 100K account at 1% ER.
The honest framing: 1,000 engaged followers are worth more than 100,000 passive ones. Brand managers know this. The follower-count-as-status-symbol era is largely over.
What quietly hurts your engagement rate
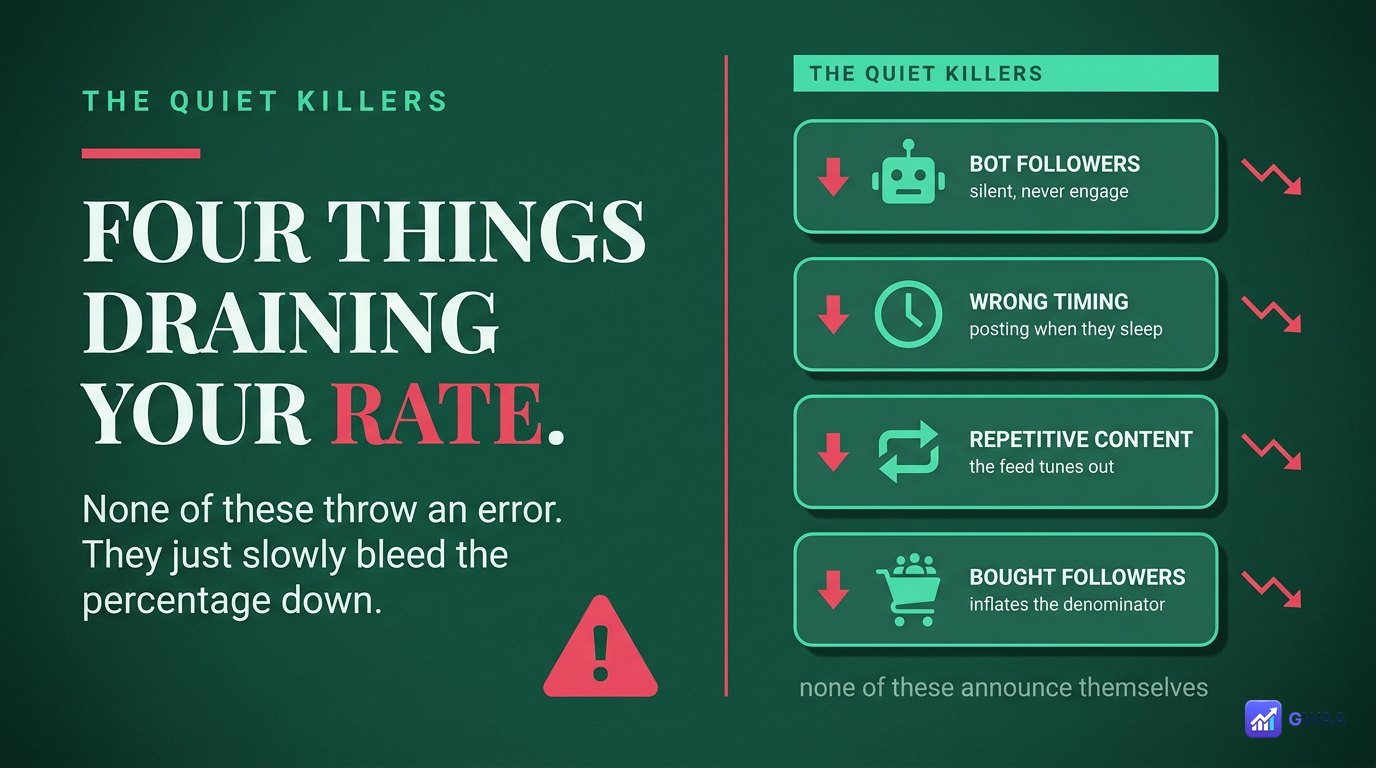
Four common patterns that silently tank engagement rates:
- Bot followers. Bots inflate your follower count but never engage. Every bot follower lowers your engagement rate proportionally. Some accounts accumulate bots passively from giveaway entries or shoutout exchanges.
- Wrong posting times. Posting when your audience is asleep means low initial engagement, which the algorithm interprets as low-quality content, which suppresses further reach. Use your Insights to find peak times.
- Repetitive content. If every post looks the same, audiences tune out. Mix formats — reels, carousels, single images, stories — to keep engagement fresh.
- Bought followers. The worst of all. Purchased followers are bots; they inflate count and crater your engagement rate. Brands using influencer-platform tools can spot purchased followers in seconds.
How to check engagement rate for any account
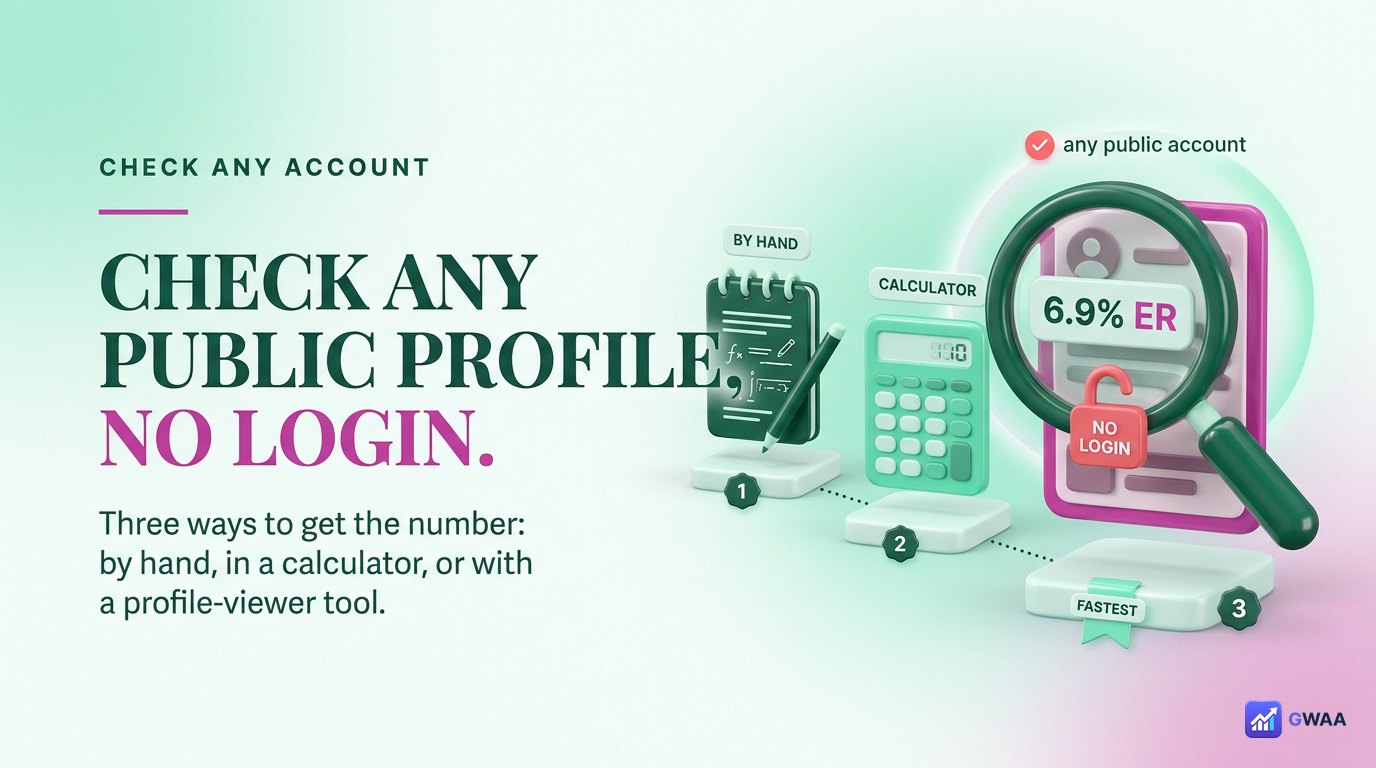
Three ways to calculate engagement rate:
- Your own account (business / creator): Instagram Insights shows it automatically. Profile → menu → Insights → per-post or aggregate views.
- Your own account (personal): Calculate manually. Sum the likes, comments, saves and shares from your last 10 posts; divide the average by your follower count; multiply by 100.
- Any public account: Use a profile-analysis tool like the GWAA Profile Viewer (viewer.gwaa.net). Type any public username, get the engagement rate plus avg likes, avg comments, posting cadence, etc.
Tools that work for public accounts give you the same data you’d see in their Insights, calculated from public post performance.
How to improve your engagement rate
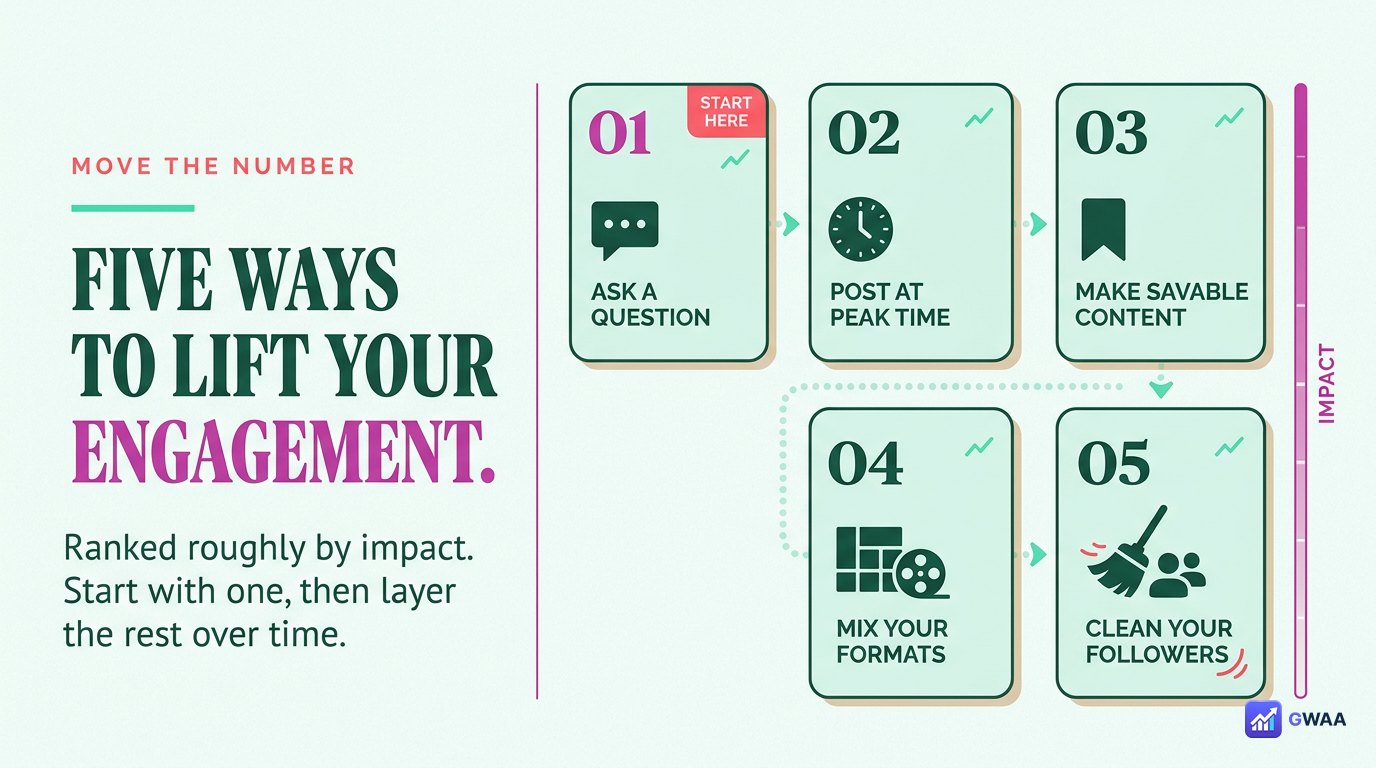
Five proven tactics, ranked roughly by impact:
- Post at your audience peak times. Check your Insights for when your followers are most active. Posting at those times often doubles engagement compared to off-peak times. Most accounts find evenings (6-9pm local time) and weekend mornings work best.
- Ask questions in your captions. Direct prompts (“What do you think?”, “Have you tried this?”) drive comments. Comments and saves are weighted highest in the algorithm.
- Reply to early comments quickly. Engaging with the first 5-10 comments within an hour of posting signals algorithm quality and extends reach. Set a 15-minute timer after posting to reply.
- Mix formats. Don’t post only static images. Rotate reels (high reach), carousels (high engagement), single images (efficient), stories (constant audience contact). Each format has different engagement profiles.
- Audit and delete fake followers. Use a tool to identify suspected bots and inactive accounts. Removing 1,000 bots from a 10K-follower account boosts your engagement rate noticeably and you don’t lose real engagement (because bots weren’t engaging anyway).
A quick worked example
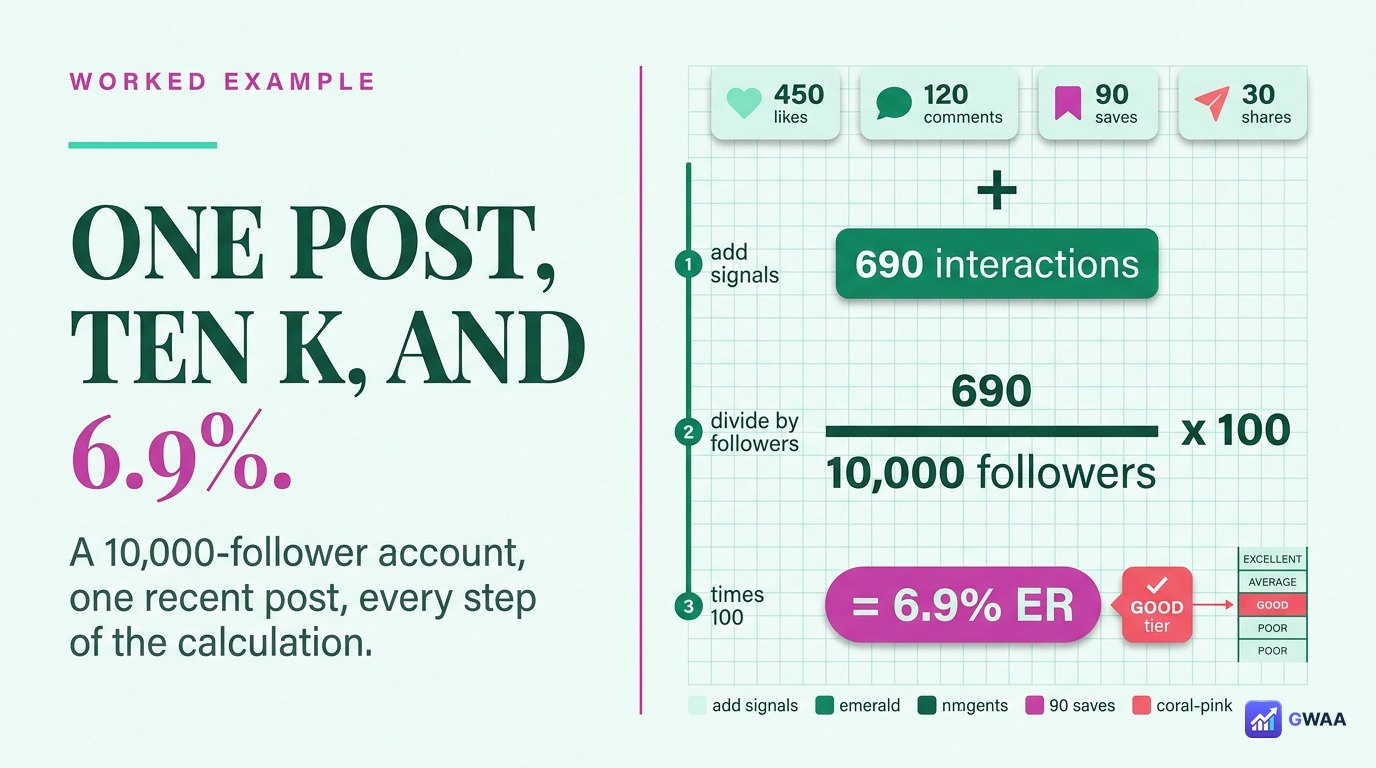
Suppose an account has 10,000 followers, and a recent post got:
- 540 likes
- 38 comments
- 89 saves
- 23 shares
Total engagement = 540 + 38 + 89 + 23 = 690.
Engagement Rate = (690 ÷ 10,000) × 100 = 6.9%.
This is in the “Excellent” tier — well above average. For a 10K-follower account, anything above 4% would be considered above-average for the bracket; 6.9% is the kind of rate that attracts brand partnerships and signals a genuinely engaged audience.
Engagement rate vs. reach — what’s the difference?
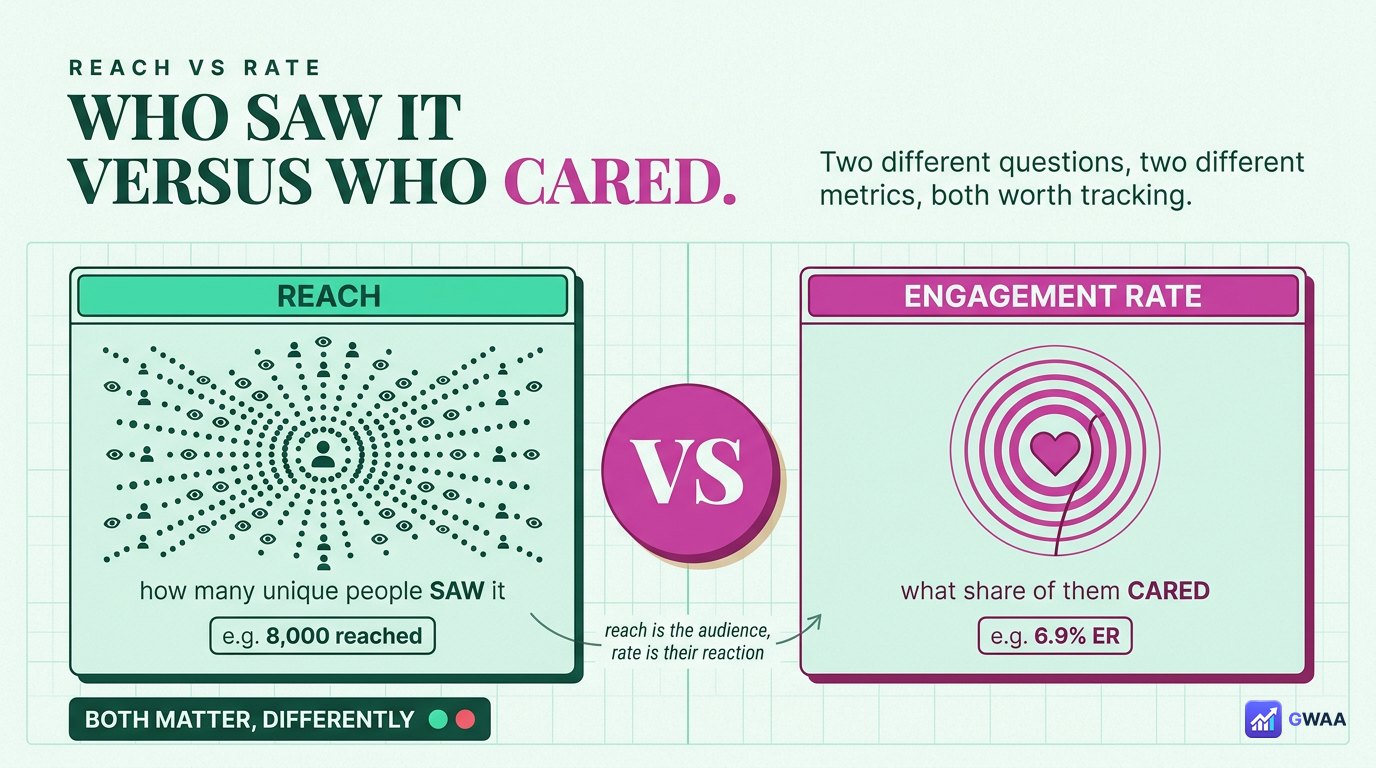
Two metrics often confused:
- Reach: The number of unique accounts that saw your post (or story). A pure exposure metric. “42,000 people saw this post”.
- Engagement Rate: The percentage of those (or your followers) who interacted with the post. A quality metric. “6.9% of my followers liked/commented/saved/shared”.
You can have high reach with low engagement (a viral but shallow post) or low reach with high engagement (a niche post that resonates deeply). Both are valid outcomes; which one matters depends on your goal:
- Brand awareness? Reach.
- Audience loyalty / monetisation? Engagement rate.
- Sustainable growth? Both, with engagement weighted slightly higher.
Auditing your follower list for bots
Bot followers are the #1 silent killer of engagement rate. If your rate is below industry benchmarks and you can’t figure out why, the answer is often that 10-40% of your followers are inactive accounts or bots. A quick self-audit:
- Spot-check 20 random followers. Open their profiles. Do they have profile pictures? Posts? Real engagement on their own posts? Or are they obvious empty-shell accounts with default avatars and no posts?
- Look at follower growth patterns. Did you gain 5,000 followers overnight after a viral moment? Some are real, but a significant fraction are bots that piggyback on trending content.
- Use third-party audit tools. Several free Instagram audit tools score your follower list for likely-fake percentage. If your “fake follower percentage” is over 10%, your engagement rate is suppressed by it.
- Remove suspected fakes. Manually block obvious bots, or use a follower-cleanup tool. You’ll lose follower count but gain engagement rate immediately.
Some creators delay this cleanup because they don’t want to see their follower count drop. The honest reframe: brands and the algorithm both value engaged followers, not inflated counts. Cleaning out bots makes your account look better to both.
Engagement rates by industry
Engagement rate benchmarks vary by niche. What counts as “good” in one industry is average in another:
- Beauty & fashion: Higher baseline. 4-7% common, top creators hit 10%+.
- Food & recipes: Very high engagement. Saves are huge for recipe content. 5-9% typical.
- Travel: Lower than fashion, similar to lifestyle. 2-4% typical.
- Fitness: Tribal audiences engage hard. 4-7% common.
- Business / B2B: Lower overall. 1-3% is normal because audience tends to read without engaging publicly.
- News / politics: Low engagement, high reach. 1-2% typical, but reach can be 10x your follower count.
- Personal / lifestyle: Wide range. 2-6% depending on intimacy of audience relationship.
The right comparison isn’t “am I above the global average” but “am I above the average for my niche?” A fitness account at 3% is performing worse than a B2B account at 3%.
Seasonal trends affect engagement
One thing rarely discussed: engagement rates fluctuate seasonally and don’t panic when they drop temporarily:
- December: Engagement drops across the board. Audiences are busy with holidays.
- January: Bounces back. New Year content gets strong engagement.
- Summer (June-August): Lower engagement, especially in regions where people are on holiday and on phones less.
- Major news events: Personal-account engagement drops when major news dominates feeds.
If your rate drops in December but recovers by February, that’s normal. Compare year-over-year, not month-over-month, for the cleanest picture.
Choosing engagement-tracking tools
If you’re monitoring engagement for serious work (brand monitoring, your own account growth, competitor research), pick tools that show:
- Rolling 30-day rates rather than per-post snapshots. Smooths out viral-post outliers.
- Breakdown by post format. Reels vs carousels vs single posts often have very different engagement profiles.
- Trends over time. A line chart of monthly engagement reveals what stopped working before the raw numbers tell you.
- Competitor comparison. Knowing your rate is meaningless without context. Compare to similar-sized accounts in your niche.
Free analytics in your own Instagram Insights is the right starting point. For competitor research, public-profile analysis tools fill the gap.
The bottom line
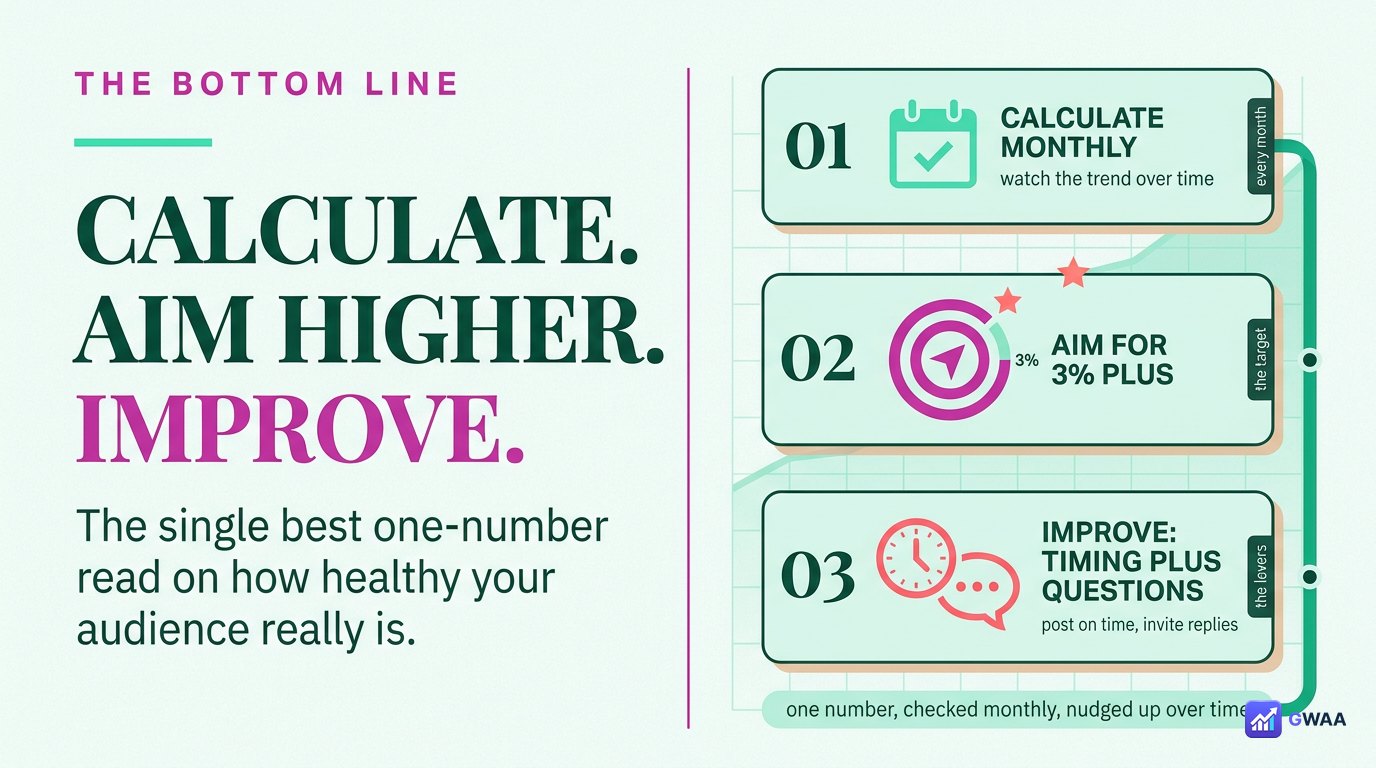
Engagement rate is the single best one-number summary of how healthy your Instagram audience actually is. Calculate it monthly, watch the trend over time, and focus on the levers that move it (posting timing, comment-driving captions, format mix, follower-list hygiene).
Three rules of thumb to internalise:
- Aim for 3%+ at minimum. Below that, something is off — bots, wrong audience fit, or content that doesn’t connect.
- Smaller accounts have higher rates. Don’t panic when your rate drops as you grow; it’s the universal pattern.
- Engagement rate beats follower count. Always. For monetisation, partnerships, algorithm reach, sales conversion — the engaged audience is the only audience that matters.